Lab Experiment 3: Gamma-Ray Absorption in Matter (Basic)
Purpose:
- To demonstrate attenuation of gamma rays in matter.
Equipment Required:

Theoretical Overview:

Gamma-ray interactions with matter
There are three dominant gamma-ray interactions with matter:
- Photoelectric effect
- Compton effect
- Pair production
Photoelectric effect
The photoelectric effect is a common interaction between a low-energy photon and a material. In this process the photon interacts with an electron in the material losing all of its energy. The electron is ejected with an energy equal to the initial photon energy minus the binding energy of the electron. This is a useful process for spectroscopy since an output pulse in a detector is produced that is proportional to the gamma-ray energy, as all of the energy of the gamma ray is transferred to the detector. This produces a characteristic full-energy peak in the spectrum that can be used for the purpose of identifying the radioactive material.
The probability of the photoelectric effect is strongly dependent on the Z of the atoms in the matter and the photon energy; it is the dominant process at low photon energy. The probability has discontinuities at the binding energies of the electrons in the constituent atoms in the matter because the probability of transferring the energy to an electron with higher binding energy than the incoming photon energy is zero. The probability of the photoelectric effect therefore rapidly decreases when transitioning from a photon energy just above the binding energy of the electrons to an energy just below it.
Compton scattering
In the Compton effect, the gamma ray scatters from an electron, transferring an amount of energy that depends upon the angle of scatter.

where:
E' is the scattered energy of the gamma ray.
E is the incident gamma-ray energy.
θ is the angle of scatter.
The term m0c2 is the rest mass of the electron, equal to 511 keV. The energy given to the electron is:
![]()
The maximum energy given to an electron in Compton scattering occurs for a scattering angle of 180˚, and the energy distribution is continuous up to that point (since all scattering angles up to 180˚ are possible).
If the photon is on a trajectory towards the detector it can Compton scatter at a small angle and still result in hitting the detector. However, since all Compton scattering transfers some energy to the electron, the scattered photon will not deposit its full initial energy in the detector and it will not contribute to the full-energy peak. In the vast majority of measurements performed with spectroscopic detectors the quantity that is measured is the number of counts in the full-energy peak so a Compton-scattered photon is considered to be an unwanted photon even if it ends up depositing energy in the detector.
Pair production
Pair production can occur when the gamma-ray energy is greater than 1.022 MeV and is a significant process at energies above 2.5 MeV. The process produces a positron and electron pair that slows down through scattering interactions in the matter. When the positron comes to rest it annihilates with an electron producing a pair of 511 keV gamma rays that are emitted back-to-back.
The probability of pair production is 0 up to the energy threshold of twice the electron mass (1.022 MeV/c2) and it increases with energy up to 100 MeV where it becomes constant.
The total photon interaction probability in matter
Figure 3-1 shows the probability of the three dominant interaction processes in matter as a function of photon energy. The figure displays the discontinuity at the binding energy of the electrons in the atom, the decrease of the probability of photoelectric effect when the energy increases, the dominance of Compton scattering at medium energies and the dominance of pair production at higher photon energies.

Figure 3-1: The probability of photon interaction as a function of energy
Attenuation in matter
The rate of change per unit length (dI/dx) of photons of intensity I traversing matter is given by:

where µ is the linear attenuation coefficient and this is dependent upon the proton (Z) number of the attenuating material, the material density and the photon energy.
By solving this differential equation, the intensity as a function of the length traversed I(x) can be obtained:
![]()
where I0 is the initial intensity at x=0.
Half-length
The half-length x1/2 is defined as the length at which the photon intensity is reduced to one-half. It can be expressed as:

And solving for x1/2 gives:

This means that as the attenuation of a material increases, the half-length gets shorter.
Experiment 3 Guide:
1. Ensure that the Osprey (with the NaI(Tl) detector connected) is connected to the measurement PC either directly or via your local network.
2. Place the 137Cs source in front of the detector.
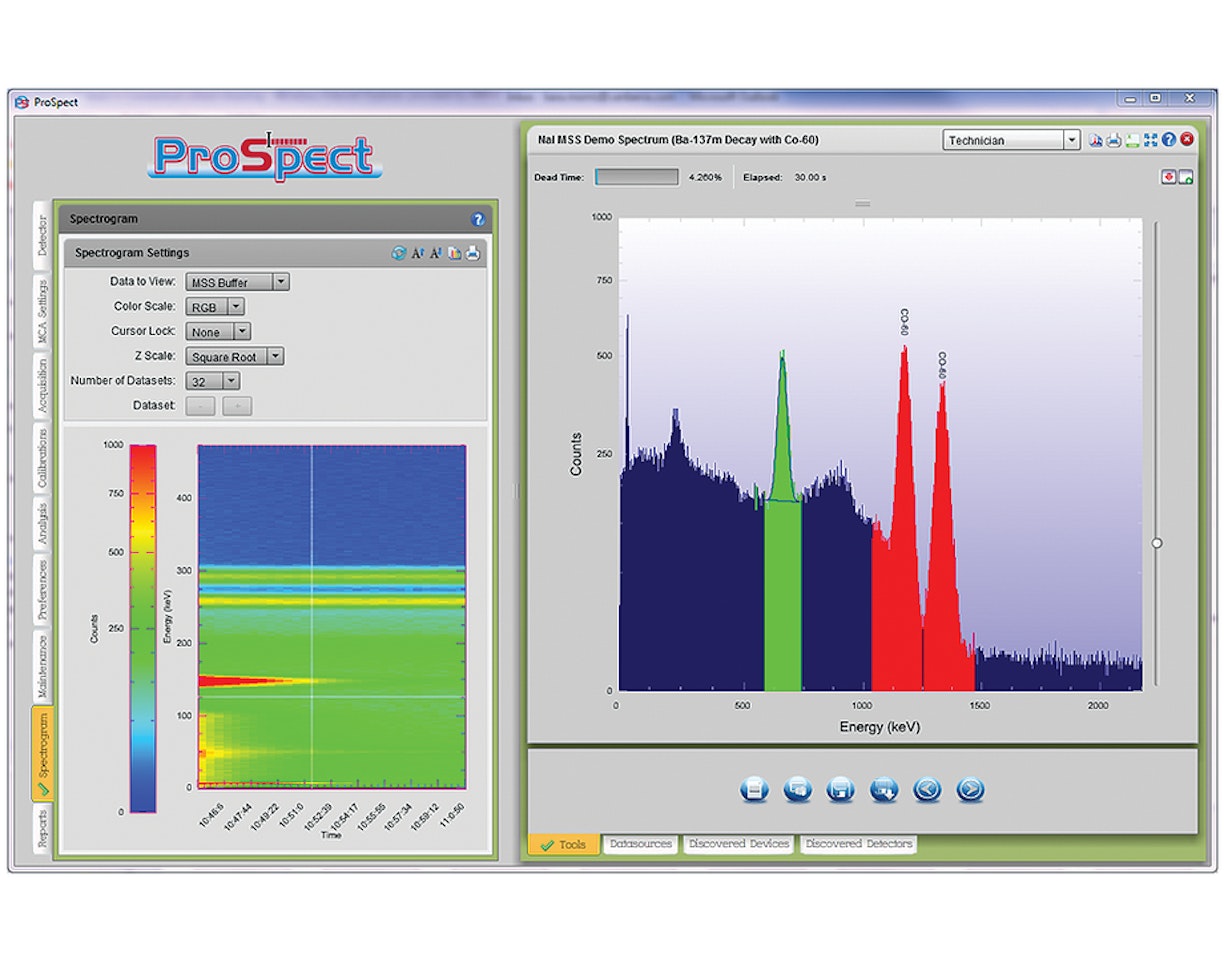
3. Open the ProSpect Gamma Spectroscopy Software and connect to the Osprey.
4. Configure your detector settings as recommended in Experiment 1.
5. Use the software to apply the recommended detector bias to the NaI(Tl) detector.
6. Set the amplifier gain such that the full-energy peak is close to one third of the spectrum.
7. Acquire a spectrum (use a count time such that there is at least 10 000 counts in the full-energy peak).
8. Make a record of the number of counts in the full-energy peak and the count time.
9. Place one piece of the aluminum attenuator between the source and the detector.
10. Acquire a spectrum (use a count time such that there is at least 10 000 counts in the full-energy peak or acquire for 5 minutes, whichever is shortest).
11. Make a record of the number of counts in the full-energy peak, the count time and the thickness of the absorber.
12. Add another piece of aluminum attenuation and repeat steps 10 and 11.
13. Repeat step 12 until there are 5 absorbers between the source and the detector.
14. Repeat step 9-13 for lead and polyethylene.
15. Repeat step 9-13 for one of the attenuator materials for a 22Na source and a 57Co source.
16. Using Microsoft Excel or another graphing application, plot the count rate (number of counts in the full-energy peak divided by the count time) for 137Cs for the three absorbers. Do the graphs have the expected shapes? Which material attenuates photons most?
17. Plot the count rate as a function of attenuator thickness for the three sources. Which source has the highest penetration through matter?
18. Using one of the plots, read out the half-length thickness for that material and energy and calculate the linear attenuation coefficient.


